ScienceExplainer
Ring, strap or watch? What the best evidence says about your overnight HRV
Heart rate variability has become the morning number for millions of athletes. A validation study against medical-grade ECG found the gap between devices is real, and explains why two wearables can disagree about the same night.

If you own a smart ring and a sports watch, you may have woken up to two different verdicts about the same night. One says you are recovered; the other says you are not. Both are usually leaning on the same signal: heart rate variability, or HRV, the small, constantly changing gaps between heartbeats that reflect, among other things, the activity of the nervous system.
HRV is a useful number. But how accurately consumer devices measure it has been surprisingly hard to establish. The most rigorous recent attempt, published in Physiological Reports by researchers in Columbus, Ohio, and at Wright-Patterson Air Force Base, gives the clearest answer so far.
What the researchers did
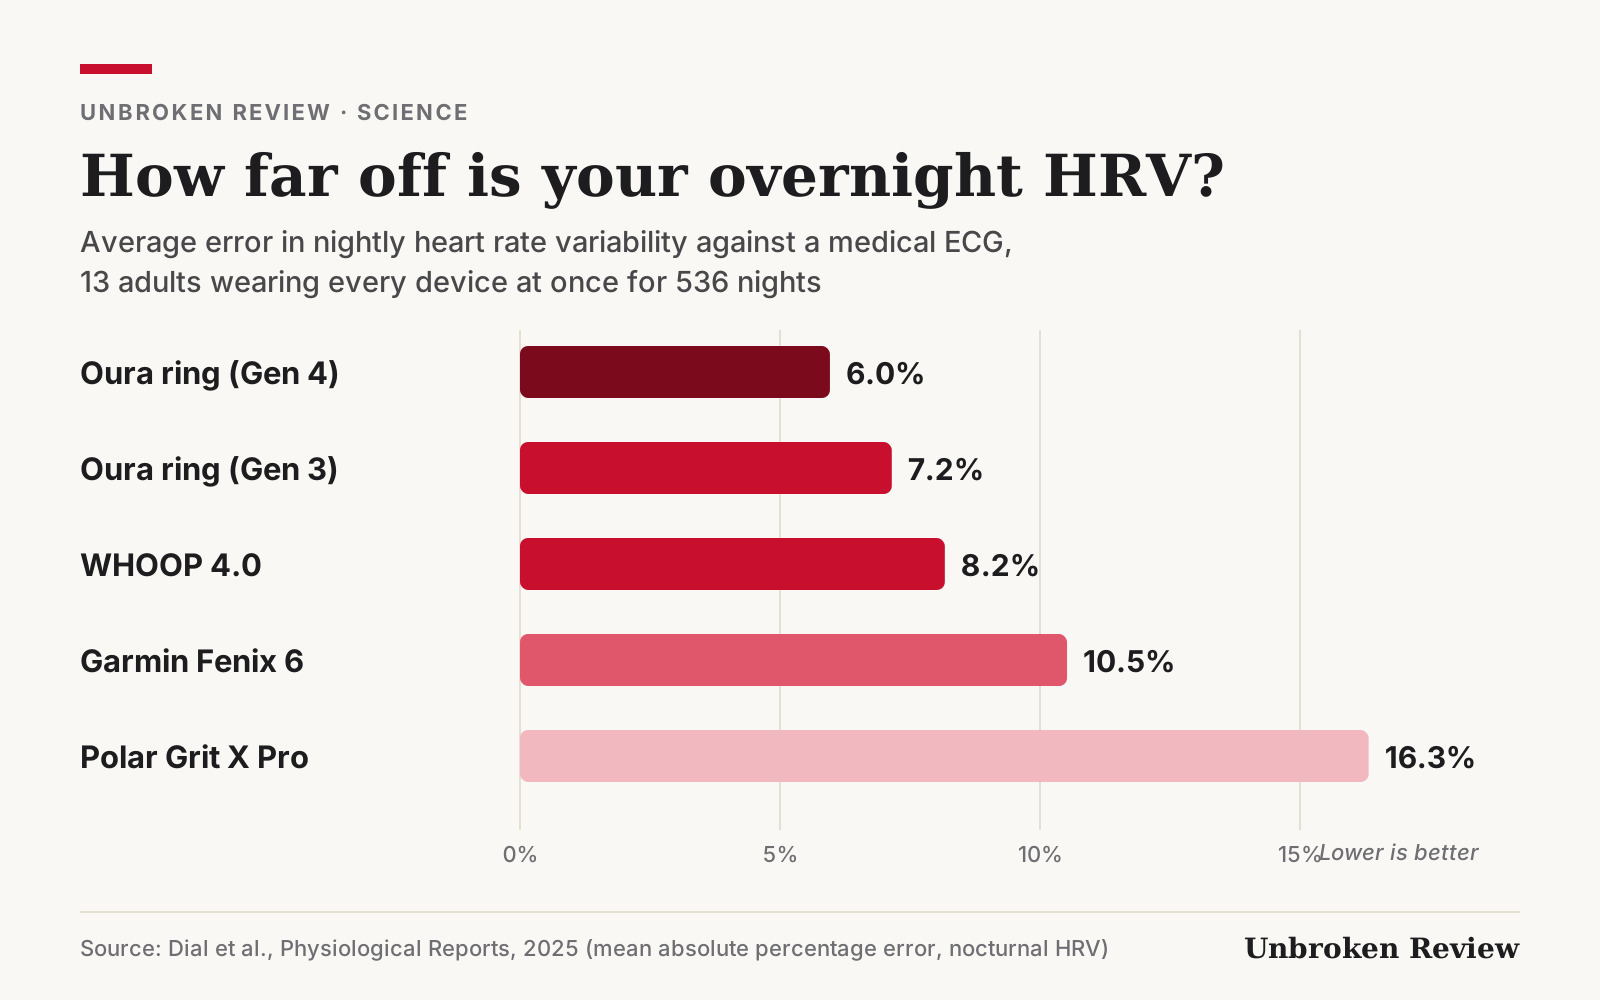
Thirteen healthy adults slept wearing a medical-grade electrocardiogram (ECG), the reference standard for measuring heartbeats, while also wearing five consumer devices at once: the Oura ring (Generation 3 and Generation 4), the WHOOP 4.0 strap, the Garmin Fenix 6 watch and the Polar Grit X Pro watch. Across the study they collected 536 nights of data.
The team then compared each device’s overnight resting heart rate and HRV with the ECG.
What they found
For overnight HRV, the average error ranged widely:
| Device | Agreement with ECG (CCC) | Average error |
|---|---|---|
| Oura Gen 4 | 0.99 | 6.0% |
| Oura Gen 3 | 0.97 | 7.2% |
| WHOOP 4.0 | 0.94 | 8.2% |
| Garmin Fenix 6 | 0.87 | 10.5% |
| Polar Grit X Pro | 0.82 | 16.3% |
CCC: Lin’s concordance correlation coefficient, where 1.0 is perfect agreement. Error: mean absolute percentage error. Source: Dial et al., 2025.
The researchers described the Oura devices as having the highest agreement, WHOOP as acceptable, and the Garmin and Polar watches as showing lower agreement. For resting heart rate, Oura again performed best; Garmin was excluded from that analysis because of methodological inconsistencies in how the data were reported.
Why the differences matter
An average error of 6 per cent and one of 16 per cent are not the same thing in practice. Day-to-day changes in HRV that athletes use to guide training are often of a similar order. A device with a larger error can make a normal night look like a bad one, or hide a genuine drop.
The results also help explain the familiar disagreement between devices. A ring worn on the finger and a watch on the wrist measure the pulse in different places, sample it differently, and apply their own processing and averaging windows. Two devices can be “accurate” by their own definitions and still report different numbers.
What it means for you
Three practical lessons follow.
Compare yourself with yourself. HRV values are highly individual and device-specific. The most reliable use of any wearable is to track your own trend on the same device over weeks, not to compare your number with someone else’s or across brands.
Look at trends, not single nights. Because every device has some error, a rolling average over several days is more trustworthy than any one morning’s reading.
Pair the number with how you feel. A wearable’s readiness score is an estimate. Combined with simple self-reports (sleep quality, soreness, mood, motivation), it becomes far more useful than either on its own.